OCEANLYZ GUI Interface#
OCEANLYZ GUI has 4 main sections:
Menu bar
Toolbar
Tabs
Working space
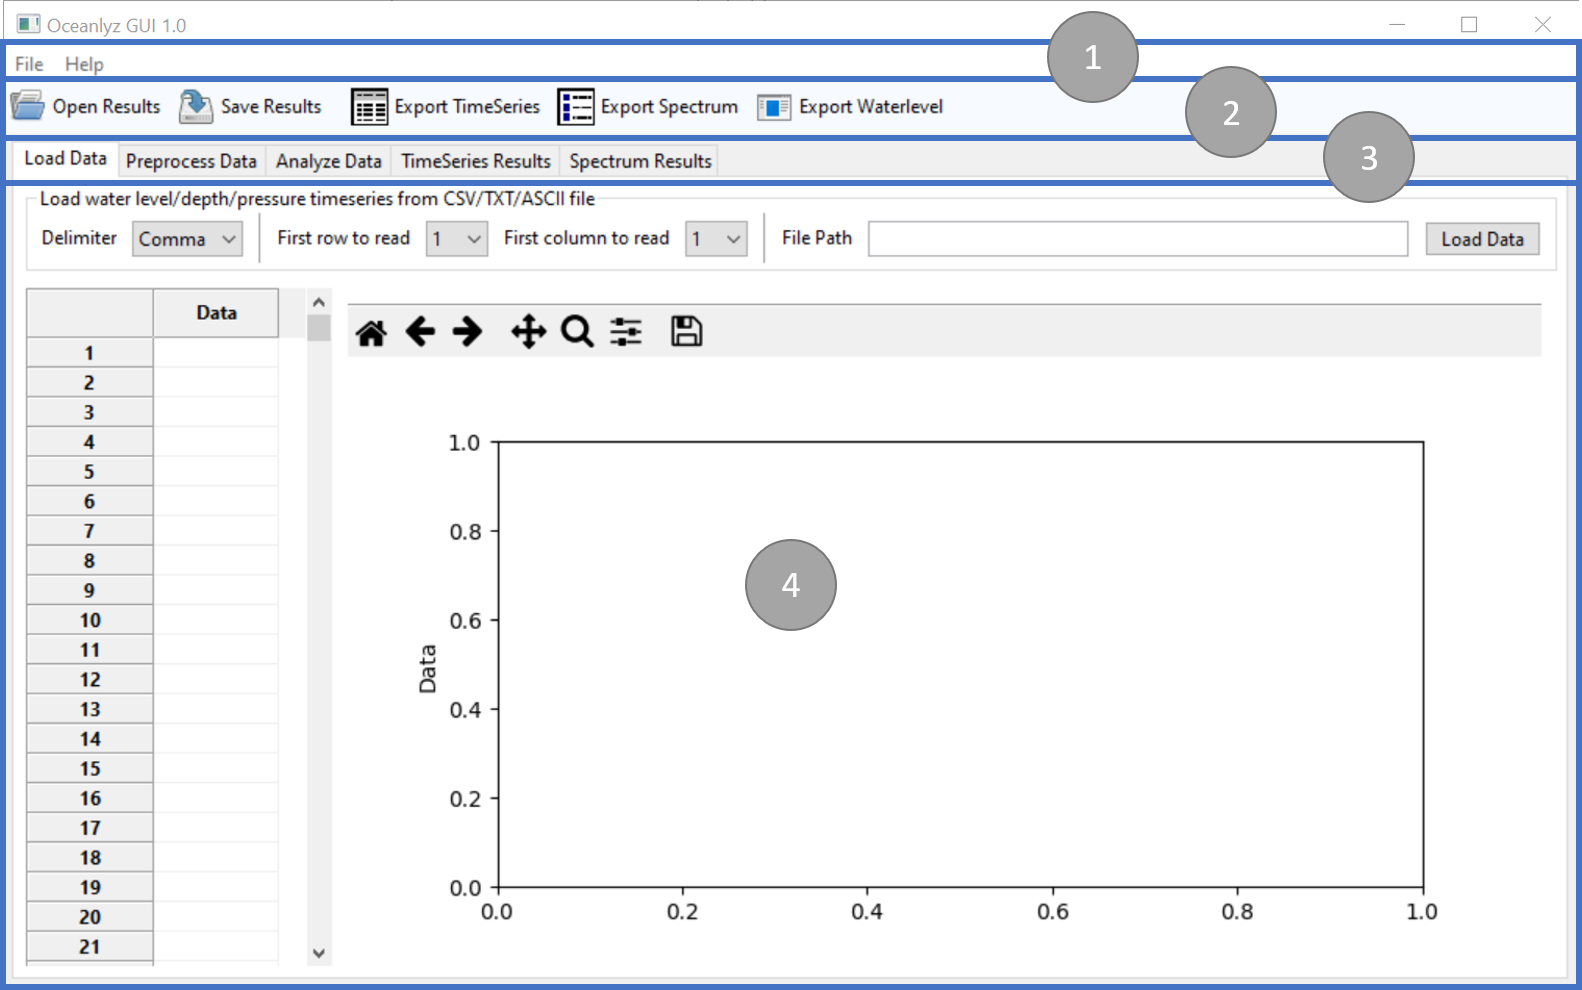
Figure: OCEANLYZ GUI Interface#
Panel 1#
Panel 1 contains main menu bar.
Panel 2#
Panel 2 contains toolbar.
Panel 3#
Panel 3 contains GUI tabs. OCEANLYZ GUI uses a tab interface for its workflow. It contains following tabs:
- Load Data tab
Load (import) measured (raw) data into the application.
- Preprocess Data tab
Clean loaded data before start analyzing them.
- Analyze Data tab
Define analysis parameters and start analyzing data.
- TimeSeries Results tab
Shows and plots time-series results.
- Spectrum Results tab
Shows and plots spectral analysis results.
Panel 4#
Panel 4 shows workplace. Each tab has its own workplace.