Time-Series Results#
In the fourth tab of OCEANLYZ GUI, time-series results can be shown and plotted.
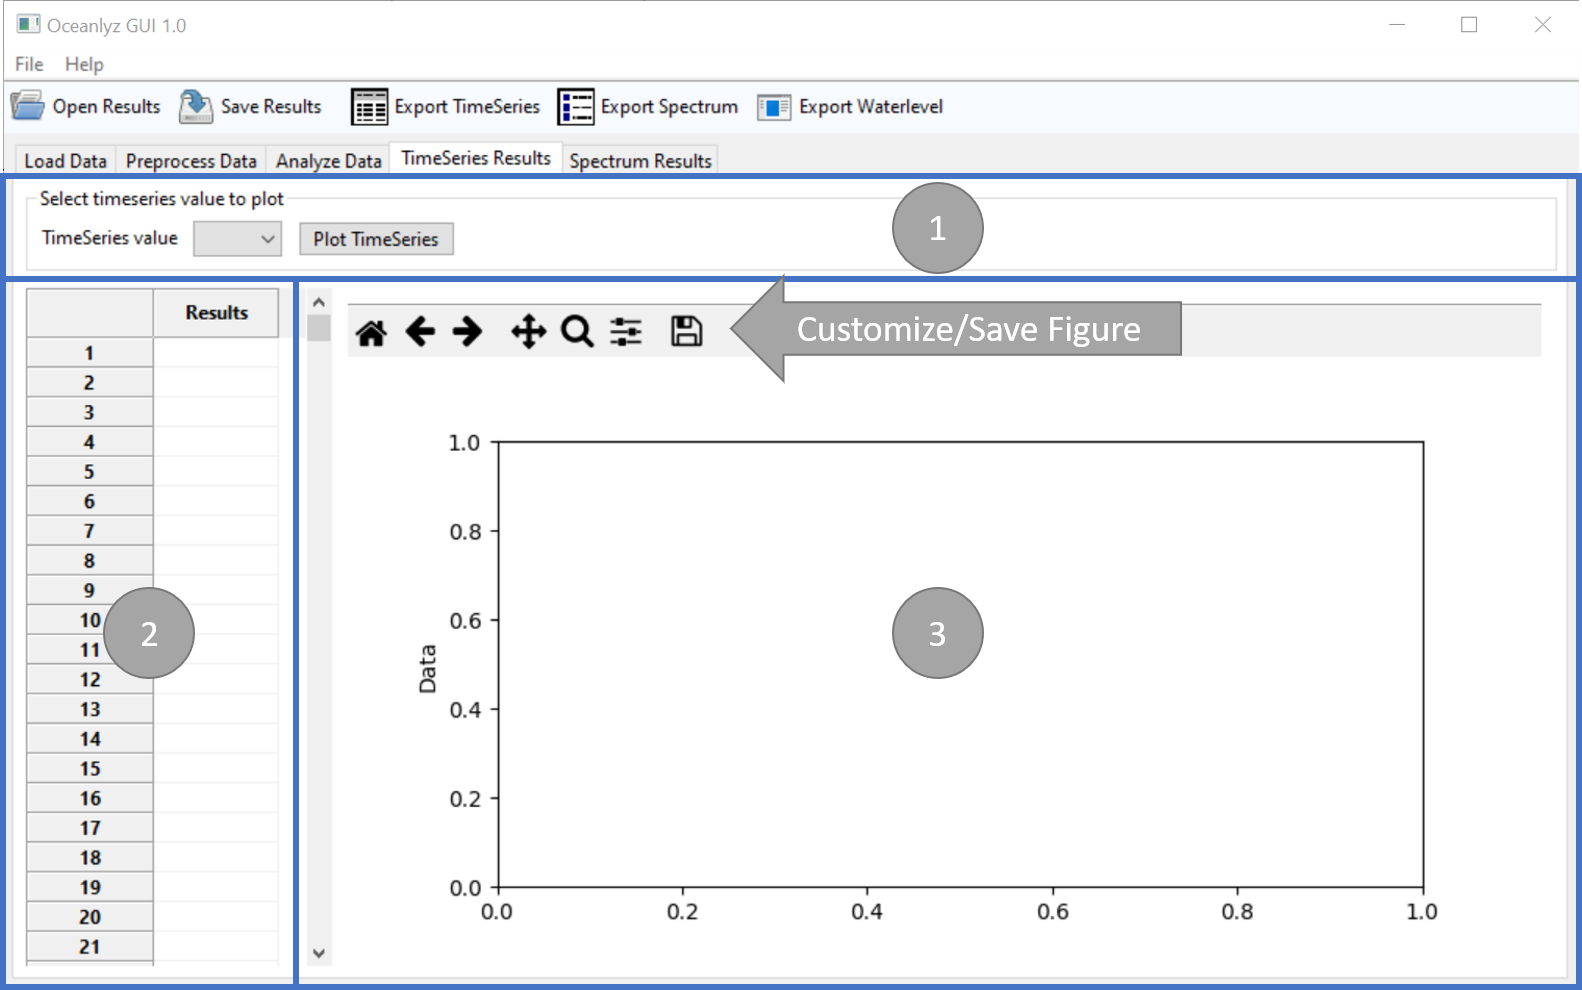
Figure: TimeSeries Results tab#
Panel 1#
Time-series values to be shown/plotted can be selected in panel 1.
Time-series values for spectral analysis are some or all of the followings (Depend on analysis parameters):
- Hm0
Zero-moment wave height (m)
- Tp
Peak wave period (s)
- fp
Peak wave frequency (Hz)
- Hm0sea
Zero-moment wave height for wind sea (m)
- Hm0swell
Zero-moment wave height for swell waves (m)
- Tpsea
Peak wave period for wind sea (s)
- Tpswell
Peak wave period for swell waves (s)
- fseparation
wind sea and swell waves separation frequency (Hz)
Time-series values for zero-crossing analysis are:
- Hs
Significant wave height (m)
- Hz
Zero-crossing mean wave height (m)
- Tz
Zero-crossing mean wave period (s)
- Ts
Significant wave period (s)
Panel 2#
Panel 2 shows the time-series results.
Panel 3#
Panel 3 plots the time-series results. Plots can be customized or saved by using the plot toolbar located on top of the figure.