Preprocess Data#
The second tab in OCEANLYZ GUI provides tools to clean loaded data before start analyzing them.
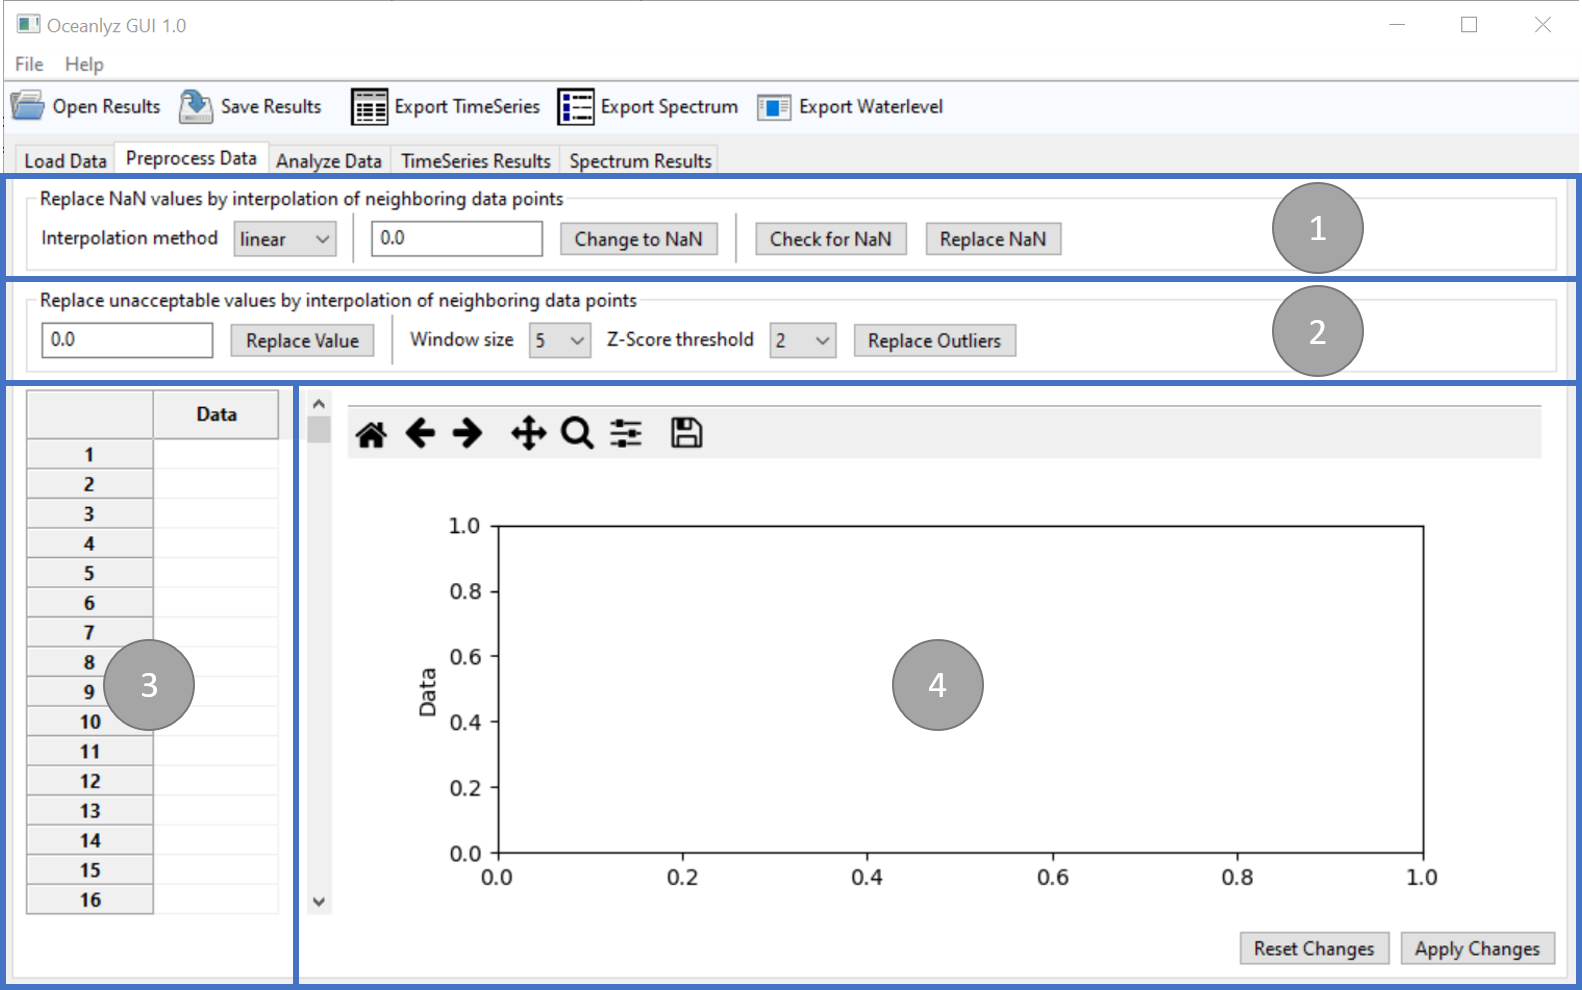
Figure: Preprocess Data tab#
Panel 1#
Panel 1 contains tools to replace NaN (Not a Number) values by interpolation of neighboring data points.
- Interpolation method
Define interpolation method to replace NaN values
- linear
Replace NaN values using linear interpolation
- nearest
Replace NaN values with nearest neighbors
- Change to NaN
Define a value to marked as NaN
This helps to mark unacceptable values as NaN. For example, sensors commonly use predefined value such as -999 to mark missing data. Now, that value such as -999 can be marked as NaN by using Change to NaN.
- Check for NaN
Check loaded data for existence of NaN values
- Replace NaN
Replace NaN values by interpolation of neighboring data points
Panel 2#
Panel 2 contains tools to replace unacceptable values by interpolation of neighboring data points.
- Replace Value
Define a value to be replaced by interpolation of neighboring data points
This helps to replace unacceptable values. For example, sensors commonly use predefined value such as -999 to mark missing data. Now, that value such as -999 can be replaced by using Replace Value.
- Window size
Define a window size used for identifying and replacing outliers
For example, if window size is 5, then 5 data points (2 on each side of data point plus data point itself) are used to identify if that data point is outlier or not.
- Z-Score threshold
Define a Z-Score threshold used for identifying and replacing outliers
- Replace Outliers
Define outlier values using Z-Score and replace them by interpolation of neighboring data points
Note: It uses interpolation method defined in panel 1
Panel 3#
Panel 3 shows the first 1000 cleaned data points for inspection.
Panel 4#
Panel 4 plots the first 1000000 cleaned data points for inspection.