Analyze Data#
In the third tab of OCEANLYZ GUI, analysis parameters are defined and data analysis is started.
For technical detail visit https://oceanlyz.readthedocs.io
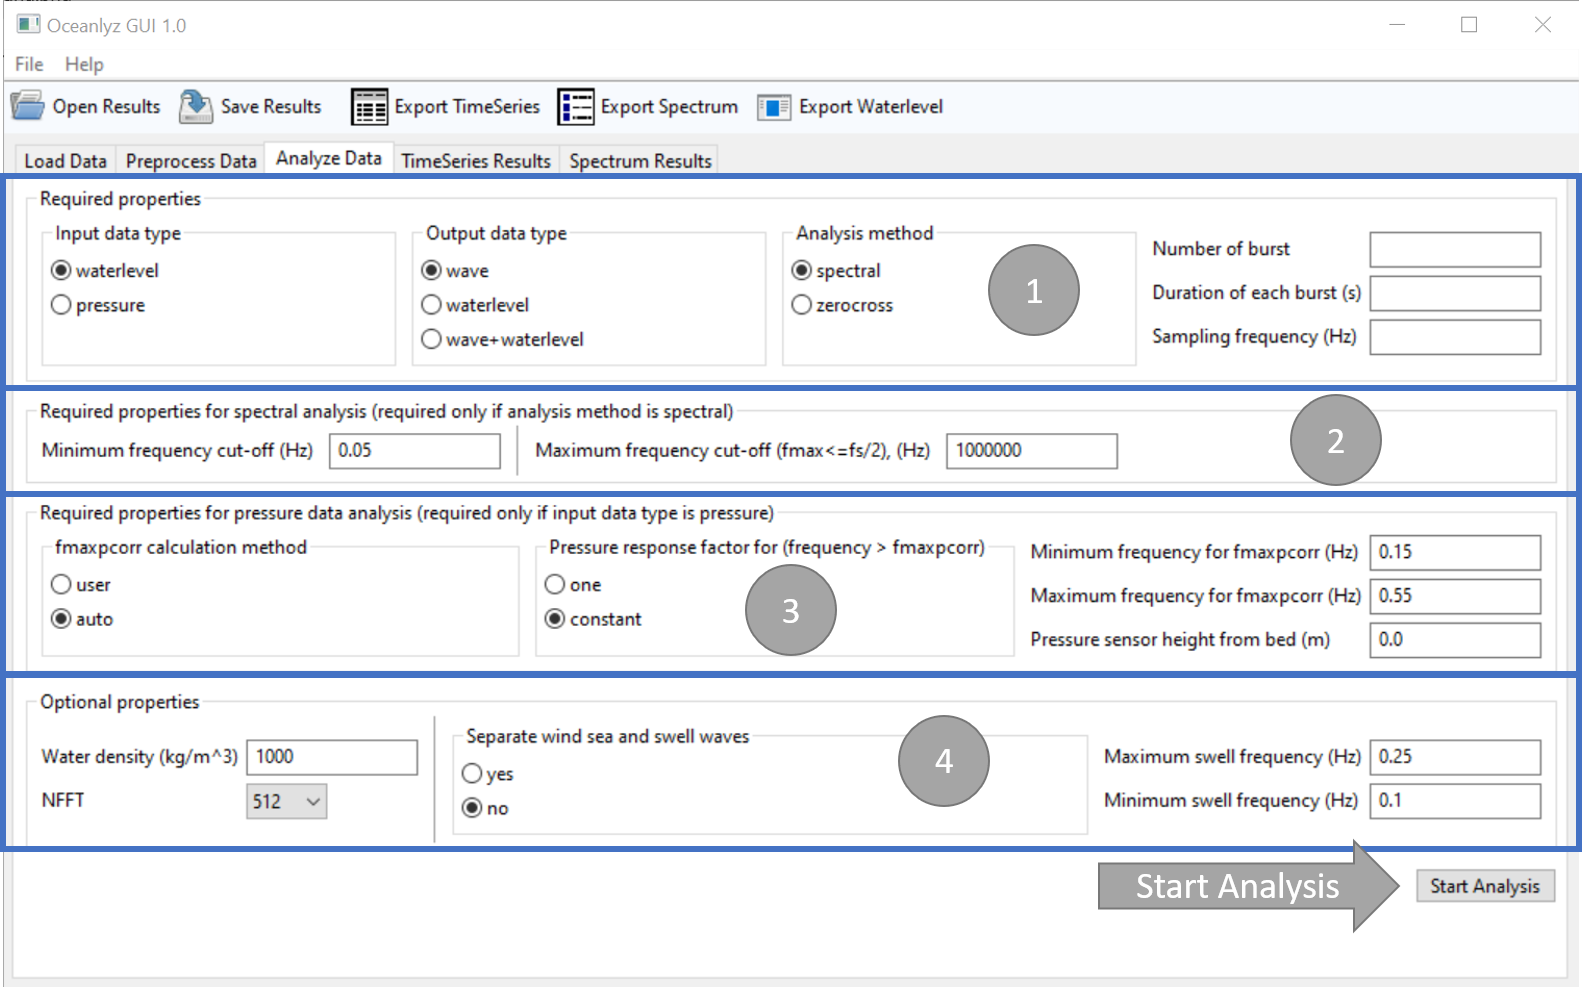
Figure: Analyze Data tab#
Panel 1#
Panel 1 contains parameters that should be set for any analysis.
- Input data type (InputType=’waterlevel’)
- Define input data type
- InputType=’waterlevel’: Input data is water level or water depth in (m)
If InputType=’waterlevel’ then OutputType=’wave’
- InputType=’pressure’: Input data are water pressure measured by a pressure sensor at sensor depth in (N/m^2)
If InputType=’pressure’ then OutputType=’waterlevel’ or OutputType=’wave+waterlevel’
- Output data type (OutputType=’wave’)
- Define output data type
- OutputType=’wave’: Calculate wave properties from water level or water depth dataOutputType=’waterlevel’: Calculate water level data from water pressure data measured by a pressure sensorOutputType=’wave+waterlevel’: Calculate waves properties and water level data from water pressure data measured by a pressure sensor
- Analysis method (AnalysisMethod=’spectral’)
- Analysis method
- AnalysisMethod=’spectral’: Use spectral analysis method / Fast Fourier TransformAnalysisMethod=’zerocross’: Use zero-crossing method
- Number of burst (n_burst=1)
- Number of burst(s) in the input file
- n_burst = (total number of data points)/(burst_duration*fs)Example:Assume data are collected for 6 hours at a sampling frequency of fs=10 HzIf data are analyzed at intervals of 30 minutes then there are 12 bursts (6 hours/30 minutes=12 bursts)For 12 bursts of data, which each burst has a duration of 30 minutes, and collected at sampling frequency of fs=10 Hzburst_duration=(30 min * 60) = 1800 secondstotal number of data points=(number of burst)*(duration of each burst)*(sampling frequency)total number of data points=(n_burst)*(burst_duration)*(fs)total number of data points=12 * 1800 * 10
- Duration of each burst (burst_duration=1024)
Duration time that data collected in each burst in (second)
- Sampling frequency (fs=2)
Sampling frequency that data are collected at in (Hz)
Panel 2#
Panel 2 contains parameters that are required for spectral analysis. In other words, these parameters are required only if analysis method is set to spectral.
- Minimum frequency cut-off (fmin=0.05)
- Minimum frequency to cut off the spectrum below that, i.e. where f<fmin, in (Hz)
- Results with frequency f<fmin will be removed from analysisIt should be between 0 and (fs/2)It is a simple high pass filterOnly required if AnalysisMethod=’spectral’
- Maximum frequency cut-off (fmax=1e6)
- Maximum frequency to cut off the spectrum beyond that, i.e. where f>fmax, in (Hz)
- Results with frequency f>fmax will be removed from analysisIt should be between 0 and (fs/2)It is a simple low pass filterOnly required if AnalysisMethod=’spectral’
Panel 3#
Panel 3 contains parameters that are required for pressure data analysis. In other words, these parameters are required only if input data type is set to pressure.
- fmaxpcorr calculation method (fmaxpcorrCalcMethod=’auto’)
- Define if to calculate fmaxpcorr and ftail or to use user defined
- fmaxpcorrCalcMethod=’user’: use user defined value for fmaxpcorrfmaxpcorrCalcMethod=’auto’: automatically define value for fmaxpcorrOnly required if InputType=’pressure’ and AnalysisMethod=’spectral’
- Pressure response factor for (f > fmaxpcorr), (Kpafterfmaxpcorr=’constant’)
- Define a pressure response factor, Kp, value for frequency larger than fmaxpcorr
- Kpafterfmaxpcorr=’one’: Kp=1 for frequency larger than fmaxpcorrKpafterfmaxpcorr=’constant’: Kp for f larger than fmaxpcorr stays equal to Kp at fmaxpcorr (constant)Kpafterfmaxpcorr=’nochange’: Kp is not changed for frequency larger than fmaxpcorr (Not implemented yet)Only required if InputType=’pressure’ and AnalysisMethod=’spectral’
- Minimum frequency for fmaxpcorr (fminpcorr=0.15)
- Minimum frequency that automated calculated fmaxpcorr can have if fmaxpcorrCalcMethod=’auto’ in (Hz)
- If fmaxpcorrCalcMethod=’auto’, then fmaxpcorr will be checked to be larger or equal to fminpcorrIt should be between 0 and (fs/2)Only required if InputType=’pressure’ and AnalysisMethod=’spectral’
- Maximum frequency for fmaxpcorr (fmaxpcorr=0.55)
- Maximum frequency for applying pressure attenuation factor in (Hz)
- Pressure attenuation factor is not applied on frequency larger than fmaxpcorrIt should be between 0 and (fs/2)Only required if InputType=’pressure’ and AnalysisMethod=’spectral’
- Pressure sensor height from bed (heightfrombed=0.0)
- Pressure sensor height from a bed in (m)
Leave heightfrombed=0.0 if data are not measured by a pressure sensor or if a sensor sits on the seabed | Only required if InputType=’pressure’
Panel 4#
Panel 4 contains parameters that are optional.
- Water density (Rho=1000)
- Water density (kg/m^3)
Only required if InputType=’pressure’
- NFFT (nfft=512)
- Define number of data points in discrete Fourier transform
- Should be 2^nResults will be reported for frequency range of 0 <= f <= (fs/2) with (nfft/2+1) data pointsExample: If fs=4 Hz and nfft=512, then output frequency has a range of 0 <= f <= 2 with 257 data pointsOnly required if AnalysisMethod=’spectral’
- Separate wind sea and swell waves (SeparateSeaSwell=’no’)
- Define if to separate wind sea and swell waves or not
- SeparateSeaSwell=’yes’: Does not separate wind sea and swell wavesSeparateSeaSwell=’no’: Separates wind sea and swell waves
- Maximum swell frequency (fmaxswell=0.25)
- Maximum frequency that swell can have (It is about 0.2 in Gulf of Mexico) in (Hz)
- It should be between 0 and (fs/2)Only required if SeparateSeaSwell=’yes’ and AnalysisMethod=’spectral’
- Minimum swell frequency (fpminswell=0.1)
- Minimum frequency that swell can have (it is used for Tpswell calculation) in (Hz)
- It should be between 0 and (fs/2)Only required if SeparateSeaSwell=’yes’ and AnalysisMethod=’spectral’
Start Analysis#
To start analysis click Start Analysis button. Note: depend on the size of data and analysis method, analysis may take a while.