Spectrum Results#
In the fifth tab of OCEANLYZ GUI, spectral results can be shown and plotted.
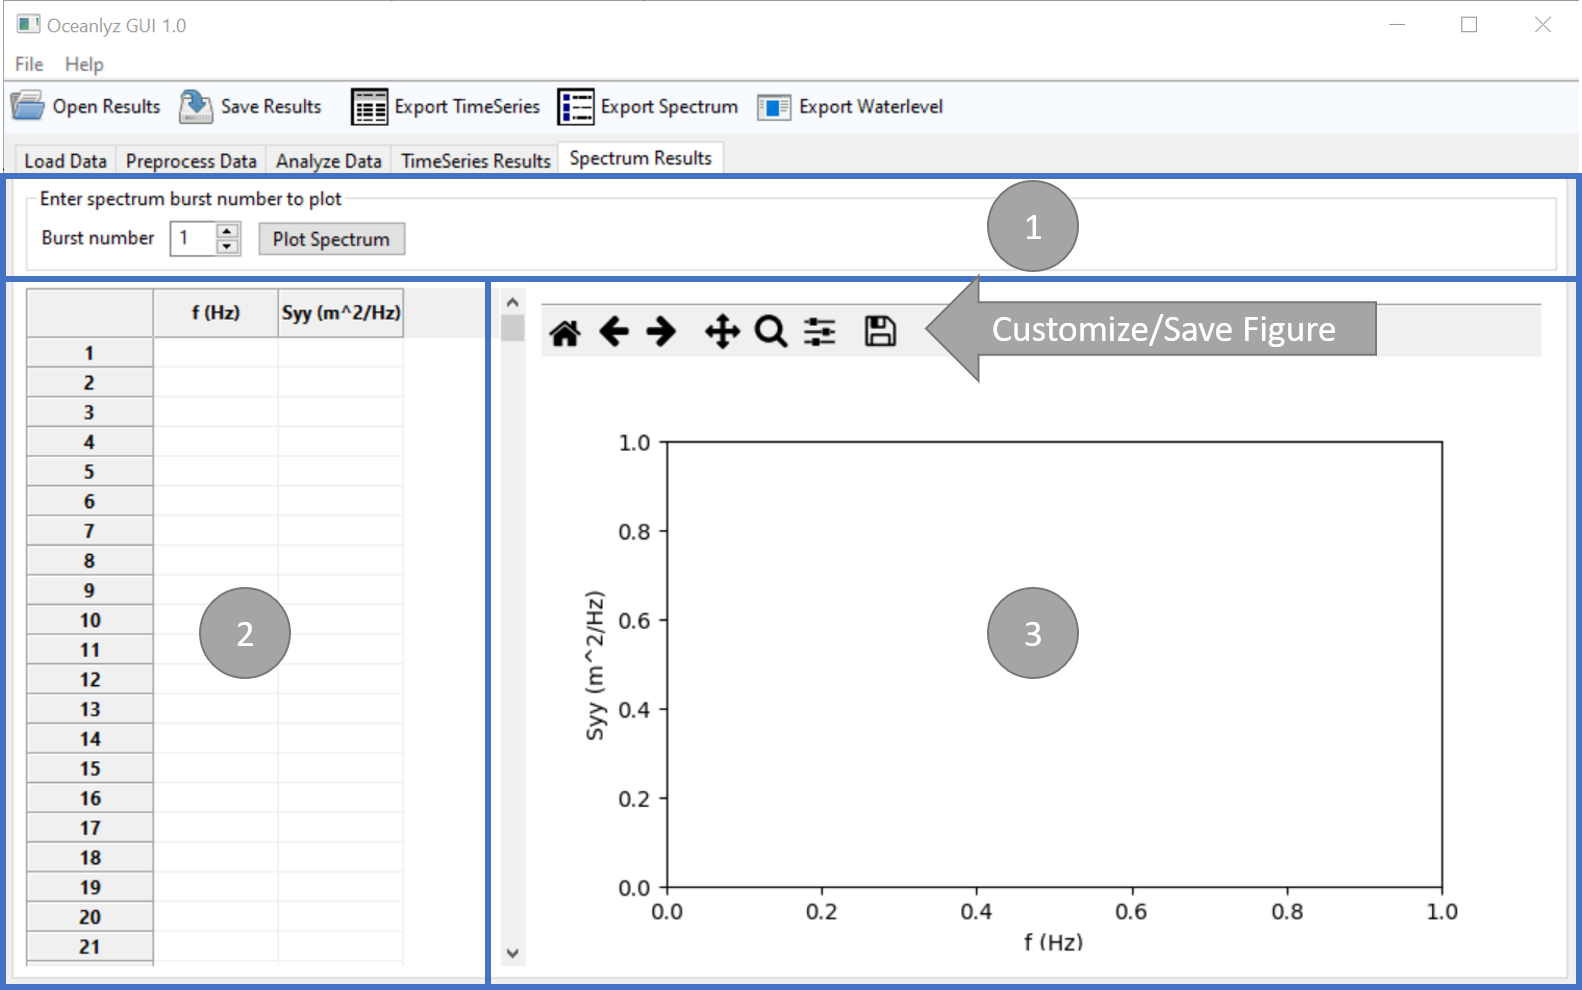
Figure: Spectrum Results tab#
Panel 1#
Spectrum values to be shown/plotted can be selected in panel 1.
Spectrum values for spectral analysis are:
- f
Frequency (Hz)
- Syy
Wave power spectral density (m^2/Hz)
Panel 2#
Panel 2 shows the spectrum results.
Panel 3#
Panel 3 plots the spectrum results. Plots can be customized or saved by using the plot toolbar located on top of the figure.